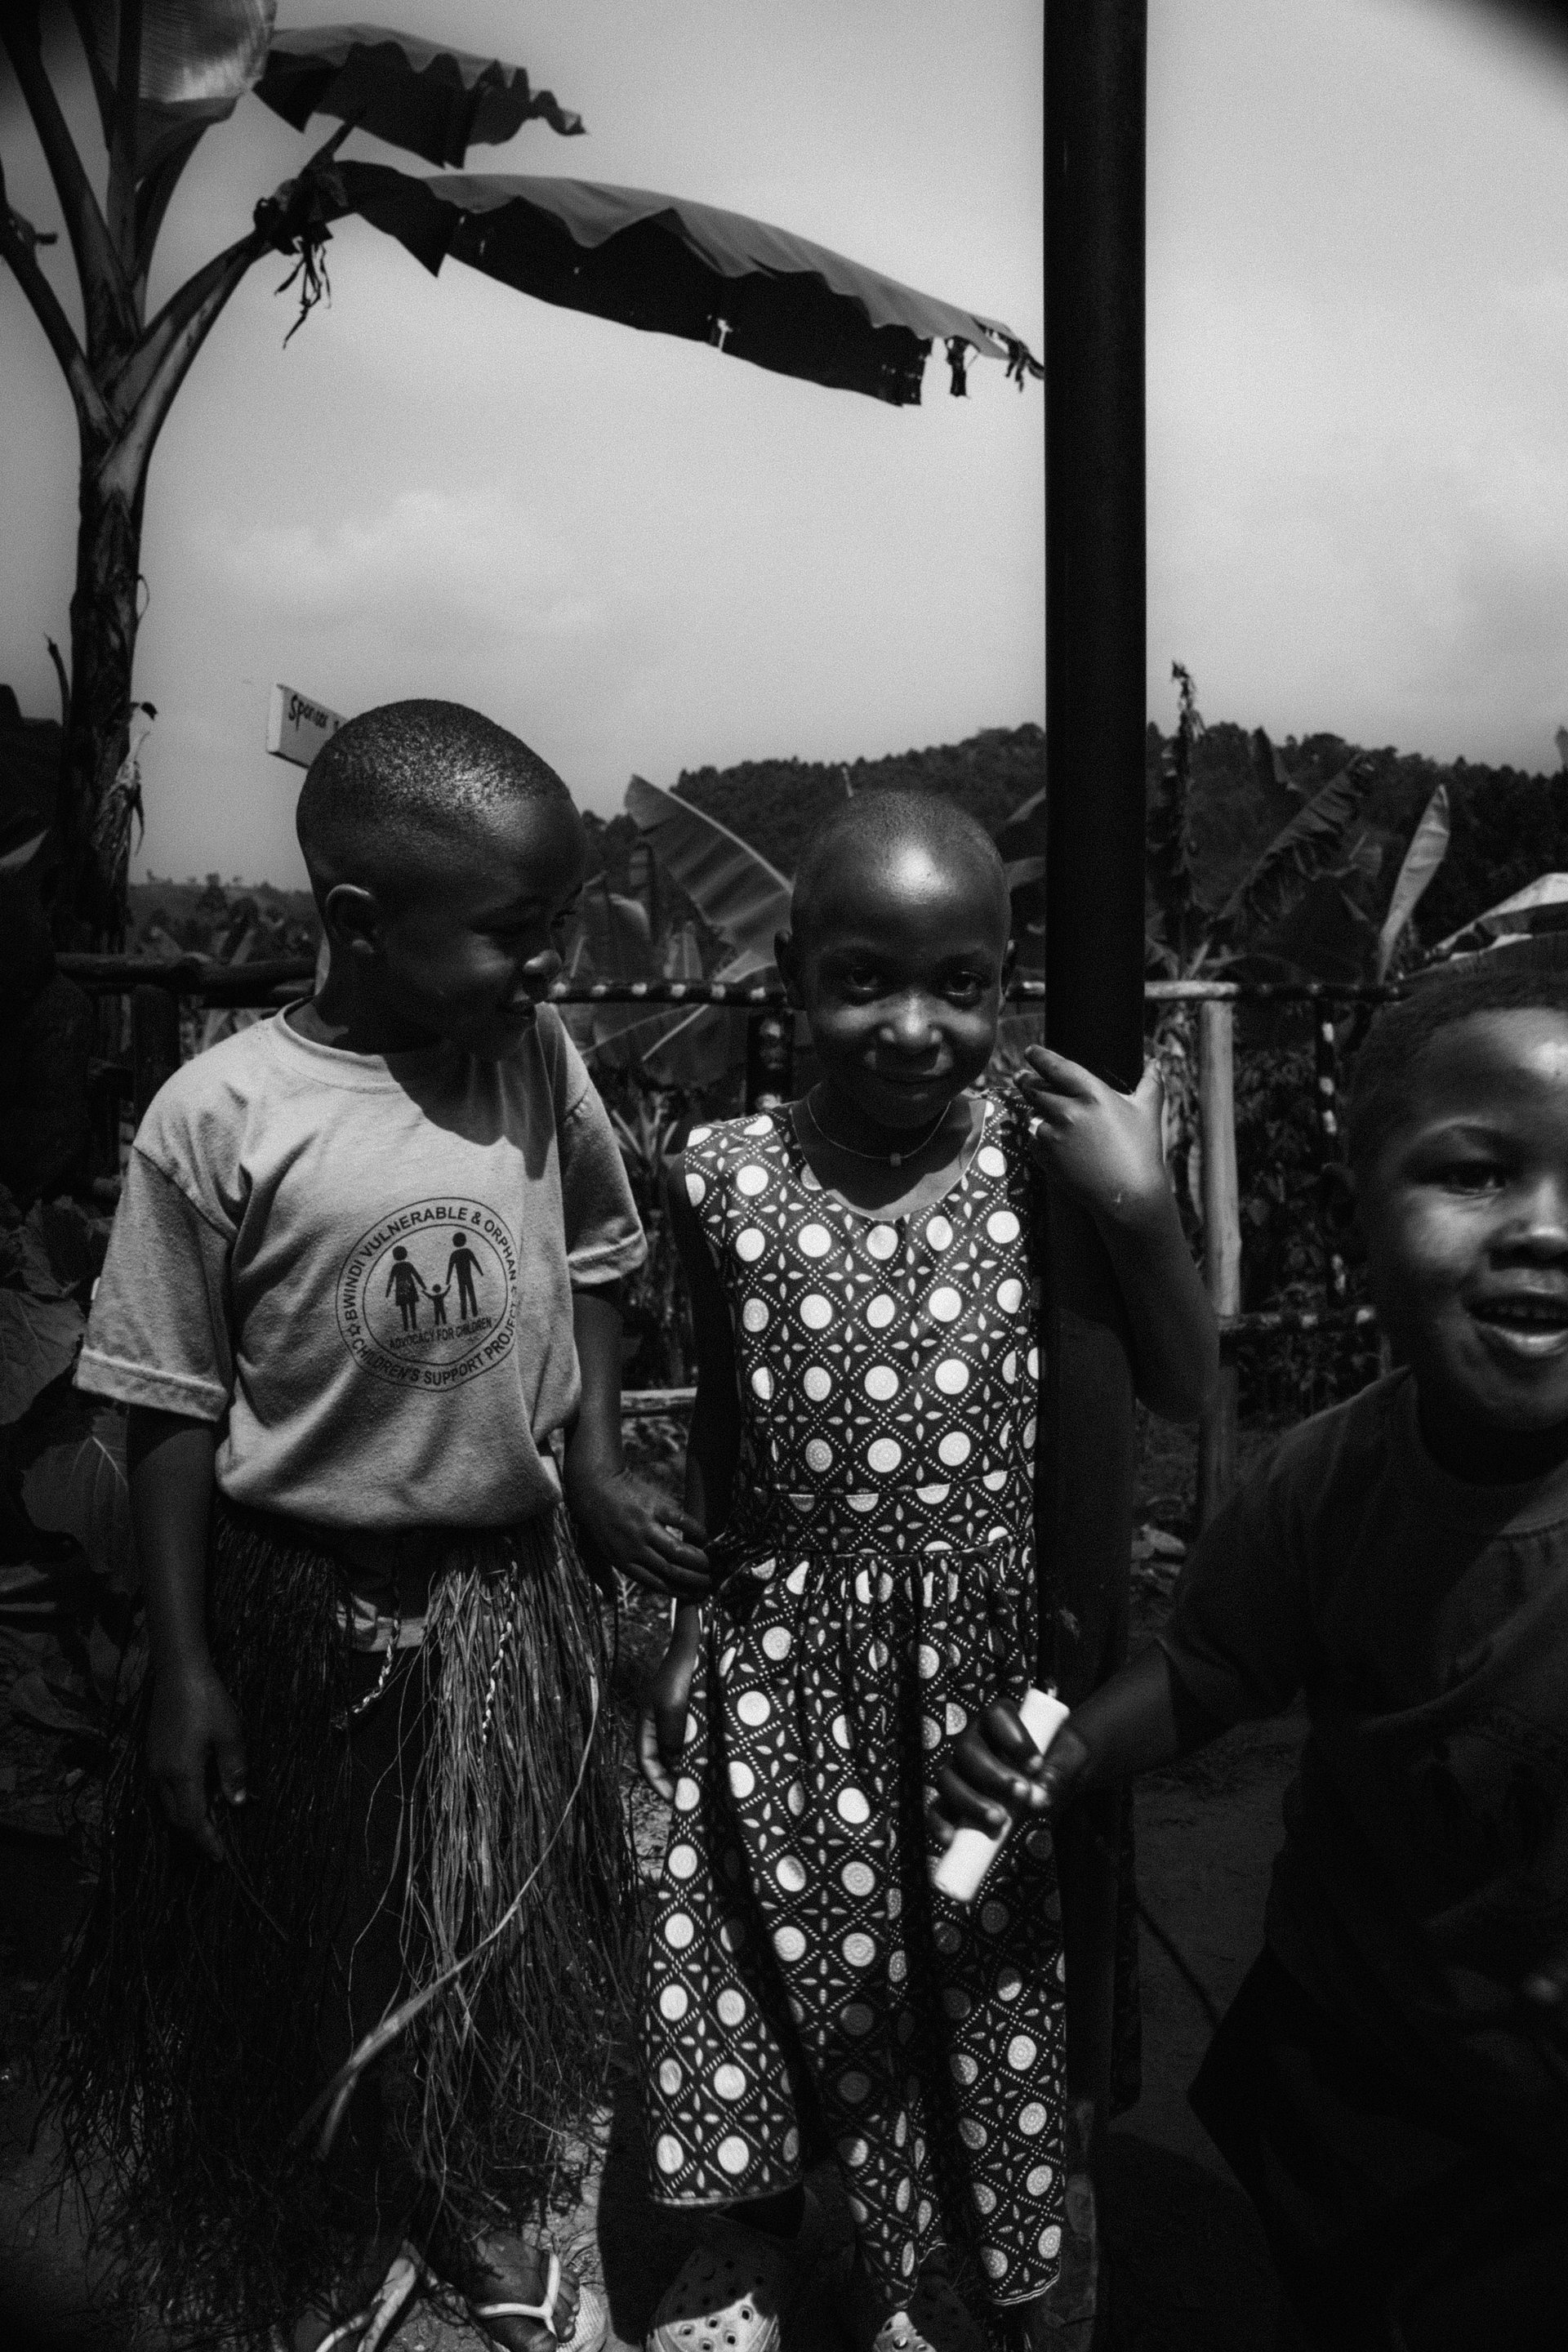
Bwindi Impenetrable National Park’s visitor numbers have grown substantially over the past decade, driven almost entirely by demand for gorilla trekking permits. Uganda’s Statistical Abstract 2014 — the government’s official annual publication documenting tourism, wildlife, and antiquities statistics — recorded visitor flows to Bwindi for the 2013 calendar year, a period when Uganda’s gorilla tourism offer was maturing but had not yet reached its current scale. During multiple visits to Buhoma between October 2024 and June 2026, including time spent at GPS -0.9665°S, 29.6127°E in the village and its surroundings, I have tried to trace how those headline statistics translate to daily life in the community that surrounds the park.
Quick Facts
- Gorilla permit (2026):
- USD 800 per person
- Permits sold FY2025:
- ~42,960 (+3.6% YoY)
- UWA revenue sharing:
- 20% of gate fees to communities
- Statistical source (2013 data):
- Uganda Statistical Abstract 2014 (UBOS)
- Mountain gorillas (global):
- Over 1,000 individuals
- Mubare family habituated:
- 1993 — Buhoma sector
- Trekking group limit:
- 8 visitors per gorilla family per day
- Author visits documented:
- 9 visits · Oct 2024–June 2026
A Morning at the Chicken Farm: What the Statistics Actually Sustain
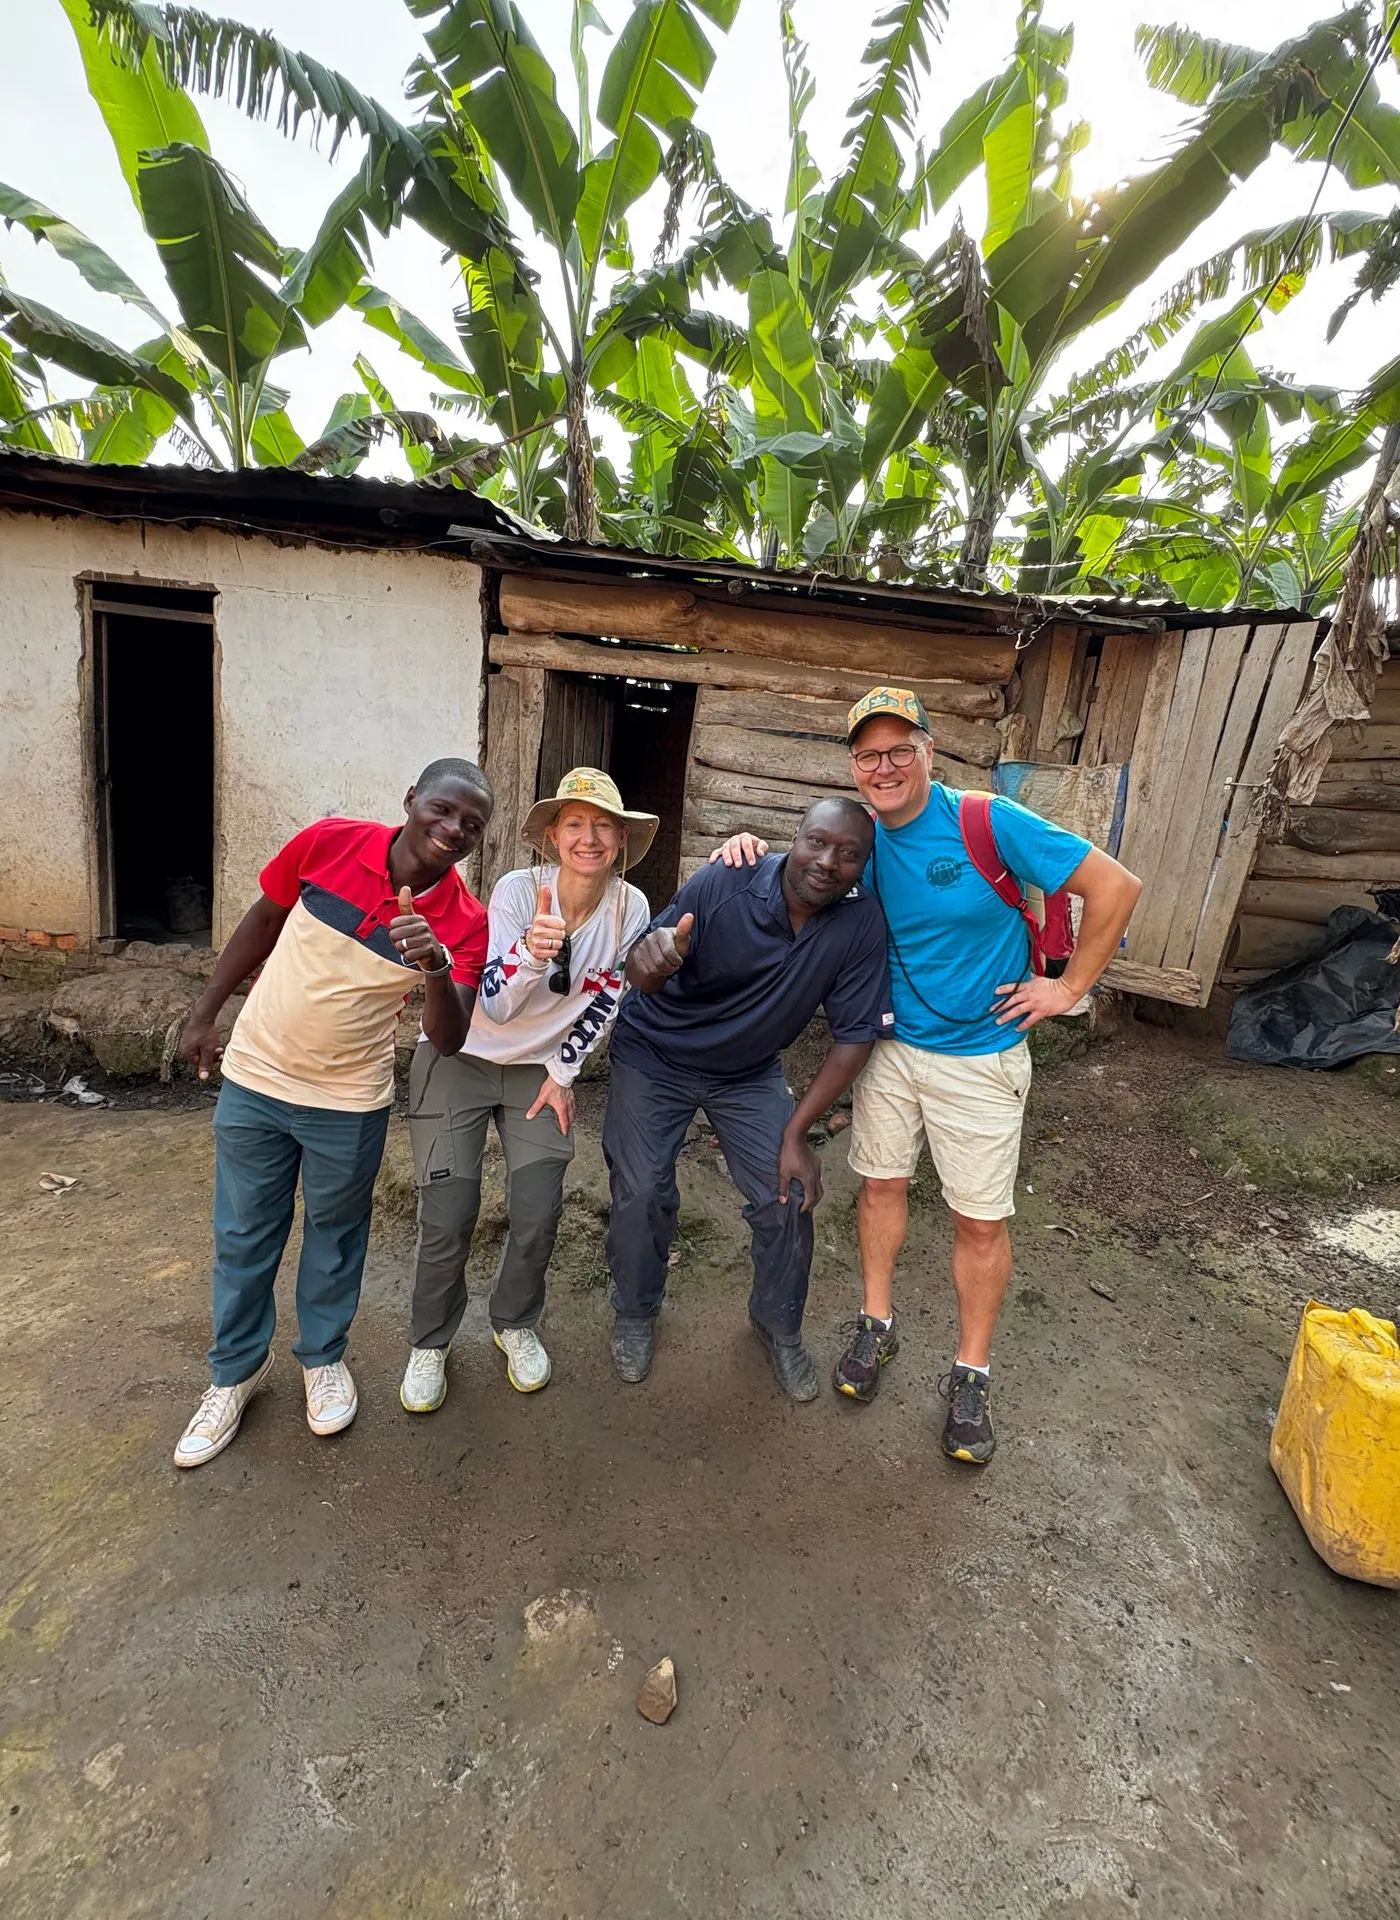
On the morning of 21 June 2026, before the sun had reached above the ridgeline separating Buhoma from the park, we drove a short distance from the orphanage compound to visit the chicken farmer. The farmer does not advertise and appears in no tourism literature. We were there to buy the first batch of chicks for the orphanage: young birds that Nicholus and Media would raise, some for eggs, some eventually for meat. At GPS -0.9713°S, 29.6142°E, we selected the birds and paid the market price. The transaction was ordinary, direct, and local in every sense that matters.
The farmer and his family presented the chicks with evident pride. The orphanage will raise most of the birds through to laying age, keeping eggs for daily nutrition. A few may eventually be eaten — though meat is a celebration in a household running on a budget that fluctuates with volunteer visits and organisational support. The economic logic is entirely self-evident once you have stood in the yard and seen it operating: a small purchase, precisely placed in a local supply chain, creates food security in a form that no donation of money alone can replicate.
I begin with this scene not because it is statistically significant — it is not — but because it places in human terms the question this article is trying to answer. When Uganda’s Statistical Abstract records Bwindi Impenetrable National Park’s visitor flows for a given year, what is being counted, indirectly, is the purchasing power that visits like ours generate in villages like Buhoma. The chicken farmer exists because there is a market. The orphanage exists because visitors bring support. The park itself exists because revenue from gorilla permits funds the rangers who keep the forest and its inhabitants protected. The statistics and the chicks are part of the same system.
Bwindi in 2013: Reading Uganda’s Statistical Abstract
Uganda’s Statistical Abstract series, published annually by the Uganda Bureau of Statistics, provides the most systematic official record of the country’s tourism performance over time. The 2014 edition — covering data for the 2013 calendar year — documents visitor numbers to Uganda’s national parks and wildlife reserves as part of a broader accounting of the tourism sector’s contribution to foreign exchange earnings, employment, and government revenue. Bwindi Impenetrable National Park appears in this framework not merely as a site but as an economic node: a place where controlled access to a globally unique wildlife encounter generates measurable flows of foreign income and distributes them, through park management and community benefit mechanisms, back into a region that would otherwise have very limited access to international economic activity.
The 2013 period represented a specific moment in Bwindi’s development as a tourism destination. Gorilla trekking had been operational from Buhoma for two decades by that point, with the Mubare family having been habituated since 1993. The park had expanded its trekking offer across multiple sectors — Buhoma in the northwest, Ruhija in the east, and the southern sector encompassing Nkuringo and Rushaga — which significantly increased the number of permits available per day compared to the park’s early years. Uganda Wildlife Authority’s pricing structure at that time made Bwindi permits affordable relative to Rwanda’s adjacent offer, driving significant visitor volume from travellers who might otherwise have chosen Volcanoes National Park across the border.
The specific 2013 visitor count recorded in the Statistical Abstract 2014 should be read alongside the methodology that governs how Uganda Bureau of Statistics compiles park visitor data. The figures include all park entries — gorilla trekking permit holders are the primary category at Bwindi, but the total also captures researchers, students, community members with special access, and day visitors who enter for non-trekking activities such as forest walks and birdwatching. The gorilla trekking component dominates, accounting for the majority of both visitor numbers and revenue in any given year.
What is clear from the broader Statistical Abstract series — across multiple editions from 2012 through 2017 — is that the early 2010s represented a sustained growth phase for Bwindi’s visitor numbers. International arrivals to Uganda overall were increasing, and Bwindi was positioned as the flagship attraction of the western Uganda circuit. The park’s multiple trekking sectors, each with separate habituated gorilla families and permit allocations, gave Uganda Wildlife Authority a capacity advantage that Mgahinga Gorilla National Park — with its single family whose range extends across the Rwandan and Congolese borders — could not match for reliability.
The 2013 data therefore sits within a trajectory: higher than the figures from 2010 and 2011, and lower than the figures that would follow in 2016 and 2017 before the sharp drop caused by the COVID-19 closure. Understanding the 2013 baseline is most useful not as a single data point but as a position on that curve — a moment when gorilla tourism in Uganda was demonstrably working as a conservation finance mechanism and a community benefit system, but had not yet been tested by the crises that would follow.
From 2013 to Today: Growth, Disruption, and Recovery
The decade between 2013 and the mid-2020s was not a smooth growth curve for Bwindi’s visitor numbers. It was a series of accelerations, collapses, and recoveries that tested the resilience of the communities that had come to depend on tourism income in a very direct way.
The period from 2013 to 2019 saw broadly consistent growth in gorilla permit sales at Bwindi, supported by Uganda Wildlife Authority’s decision to maintain its permit price at USD 600 while gradually increasing the number of habituated families available for trekking. The strategy was one of volume over margin — attracting more visitors at a competitive price point relative to Rwanda, which was simultaneously pursuing a high-price, low-volume approach. Uganda’s approach proved effective: Bwindi developed a reputation as the more accessible gorilla destination, drawing visitors who found Rwanda’s prices prohibitive while still offering encounters of comparable quality.
Uganda subsequently raised its standard gorilla trekking permit price from USD 600 to USD 700 and then to USD 800 (the current 2026 rate). The rationale was twofold: to increase revenue per permit as a way of generating more conservation finance without expanding trekking groups, and to reposition Bwindi as a premium experience. This price increase coincided with the COVID-19 closure of Uganda’s borders in 2020, which meant that the new pricing was tested first in a period of near-zero visitor numbers and then, from 2021, in a gradual recovery that eventually produced the approximately 42,960 gorilla permits sold in the 2025 fiscal year.
The 2022 Ebola scare — a brief but serious period of travel advisories following a confirmed case in Mubende District — caused a secondary disruption to Bwindi’s visitor numbers in that year, though shorter and less severe than the COVID closure. Norman Noel, a boda-boda driver who has operated in Buhoma since before the pandemic, described the period as one where income evaporated completely within days of the advisory being issued: visitors cancelled, lodges emptied, and the village’s parallel economy contracted simultaneously. The statistical record will show a dip in visitor numbers for 2022; the human record is the experience of everyone in Buhoma whose income rested on the assumption that visitors would keep coming.
Sitting by the Road: What the Village Sees of Its Own Statistics
On the same morning we visited the chicken farmer, we stopped for water at a small shop on Buhoma’s main road. A simple bench under a makeshift umbrella, the main road of the village passing a few metres in front of us, and the knowledge that on the other side of the ridgeline the gorilla families were beginning their day much as they had been beginning their days for years before any visitor ever counted them. At GPS -0.9673°S, 29.6145°E: a bench, a shade umbrella, water. Buhoma distilled to its exact components.
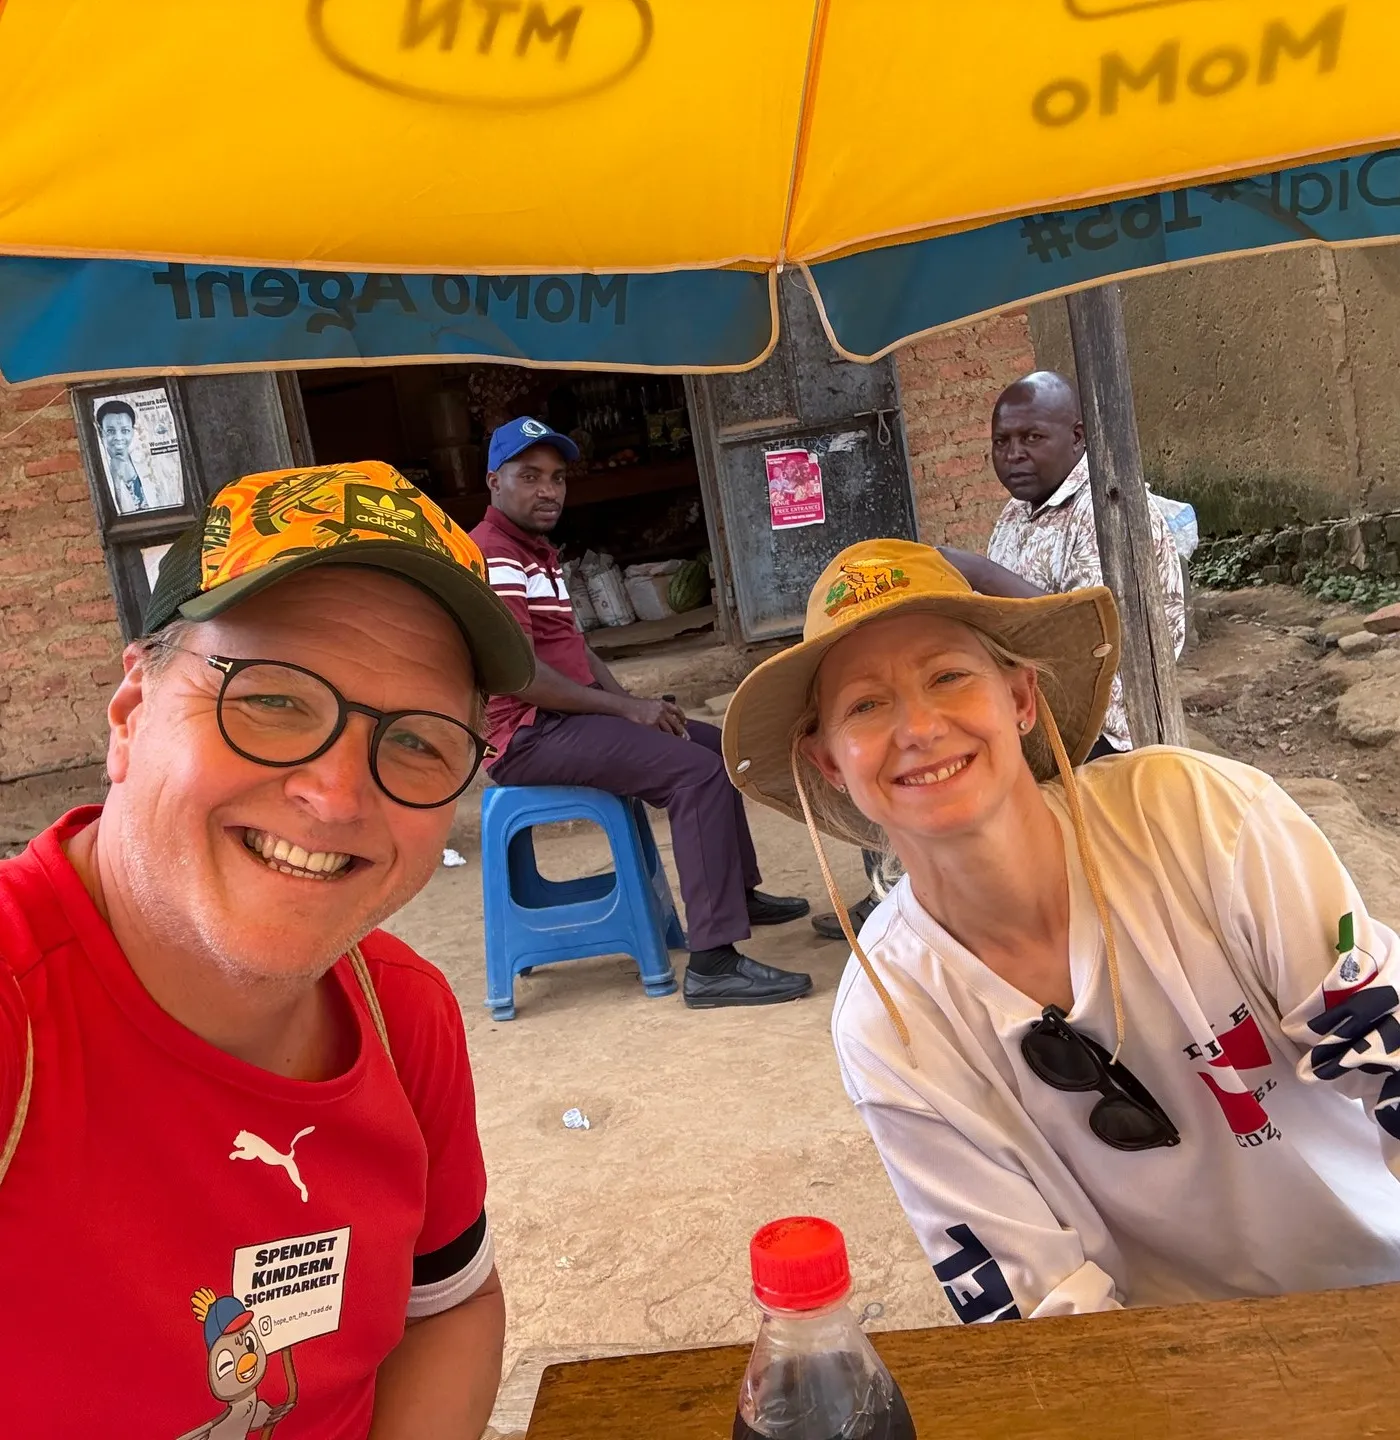
The shop owner who served us was not interested in our visit to the park. He was interested in whether we wanted still or fizzy water, whether we needed anything else, and how long we were in the area. The transaction was a few thousand Ugandan shillings — less than a dollar — and it was, in its way, a microcosm of how gorilla tourism revenue actually circulates through a village economy. The visitor arrives to see the gorillas. The permit fee goes to Uganda Wildlife Authority. A fraction returns to the community through the revenue-sharing mechanism. The larger amount returns through daily spending: on the bench, the umbrella, the water, the boda-boda driver, the restaurant that will serve lunch. The shop owner on the main road is several steps removed from the gorilla permit system, but he is not disconnected from it.
Village life in Buhoma does not present itself in the format of a statistical table. What the Statistical Abstract records as visitor arrivals translates, at the street level, into a texture that changes perceptibly between a busy week and a quiet one. In a busy week, the boda-boda station is active from before dawn, guides are gathered at the briefing centre, the lodges are at capacity, and the restaurants are running through their matooke and beans faster than usual. In a quiet week, the same locations are visibly subdued. The statistical record will show a lower permit number. The village will show the same thing in the density of activity at the roadside.
What the Statistics Mean for Conservation and Community Benefit
Uganda Wildlife Authority’s revenue-sharing mechanism returns 20 percent of park gate fees to the local governments and community institutions surrounding Bwindi Impenetrable National Park. The mechanism was formalised in the early 1990s, shortly after the park was gazetted in 1991, as a response to the displacement and livelihood disruption that communities bordering the newly protected forest experienced when they lost access to resources they had previously used. Revenue sharing was Uganda’s practical answer to a conservation problem that is not unique to Bwindi: how do you persuade communities to accept and support a national park if that park removes resources from their daily lives without returning an equivalent benefit?
The mechanism works in direct proportion to visitor numbers. In a year when Bwindi receives fewer visitors, the revenue-sharing disbursement is smaller. In a year when permits sell at a higher price and in higher volume, the disbursement increases. The 2013 baseline therefore represents a specific funding level for the schools, health facilities, and local infrastructure projects that the revenue-sharing mechanism supported in Kanungu District at that time. As permit prices have risen from USD 600 to USD 800, and as volumes have grown, the absolute amount of money flowing through the mechanism has increased.
The chicken farmer we visited on 21 June 2026 is not a direct beneficiary of the revenue-sharing mechanism. He runs a private micro-enterprise whose viability depends on the broader economic activity that gorilla tourism generates in Buhoma. His operation is several economic steps removed from the gorilla permit sold at the park gate. But the chain connecting them is real and traceable: permit revenue funds rangers who protect the gorillas, habituated gorillas attract visitors, visitors generate spending in the village, spending creates demand for local produce, demand makes the chicken farm viable. Remove the gorillas or the visitors, and the chain breaks at the point furthest from the permit counter — at the orphanage, at the shop on the main road, at the bench where two travellers stop for water on a June morning.
This is why visitor numbers to Bwindi — in 2013, in 2025, and in every year in between — are worth reading carefully rather than as abstract government data. They are not merely tourism metrics. They are, imperfectly but genuinely, a measure of the economic conditions of an entire district of southwestern Uganda that has chosen to organise its development around the presence of mountain gorillas in the forest above its hillside farms. The statistical record held in Uganda’s annual Statistical Abstracts is the closest thing we have to a continuous account of how that arrangement is working over time.